Understanding Supply and Demand gives you access to one of the most powerful tools in all of economics.
You’ll be able to understand:
- Foreign exchange (Forex) and currency prices
- How wages are determined
- How the unemployment rate responds to various market conditions
- Prices of assets in the stock market
- How interest rates are adjusted by central banks
- How bond prices work
- How something is priced: from fruits at your local grocery store to the cost of your kitchen remodel
- Why some industries thrive and others die
We’ll learn how supply works, and why the amount supplied of something tends to increase as price increases. We’ll learn how demand works, and why the amount demanded tends to decrease as price rises.
More importantly, you’ll obtain a framework for making sense of how various events will affect important economic variables.
Why Amount Supplied Increases With Price:
Would You Collect Garbage for $100K per year? How about $1 Million per year?
Think of a job that you really wouldn’t want to do, say garbage collection or janitorial services. Suppose you were offered a salary of $100K per year to do the job. Would you take it? Maybe not, but what if you were offered $1 million per year? If you’re not already a millionaire, you probably would take the job.
This example illustrates the basic idea of supply. As the price offered for anything increases, there are more and more people who are willing to provide that thing. That goes for jobs, it goes for products, it even goes for financial assets, it goes for anything.
More Expensive Apples = More Farmers
You get the idea with jobs. But how about something like the supply of apples? As the price of apples in the market goes up, more farmers decide to grow apples instead of pears and cherries. Perhaps some people that otherwise would have gone into other professions decide to become apple farmers.
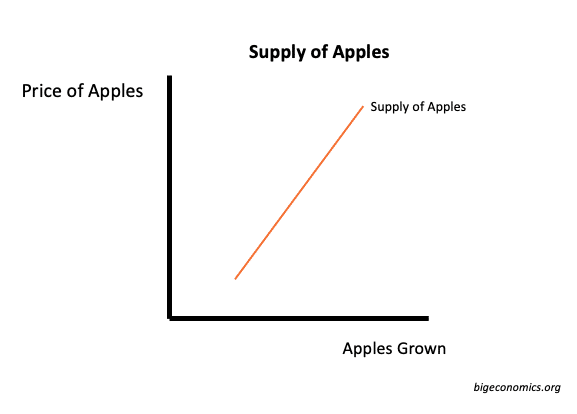
This means supply has a positive relationship with price. As the price offered for something increases more of that thing is provided.
Graphically, supply looks like an upward sloping line:
Why the Demand For Anything Decreases With Price
Demand has the opposite property, mainly because everyone has a budget, and if something is really expensive you can usually just not have it, buy less of it, or buy something else that’s almost as good.
More Expensive Labor = Less Jobs
In the section on supply, we discussed receiving an exorbitantly high salary to do some unpleasant job like picking up garbage. What would this mean for the firm that hired you? Well they could raise their prices somewhat to negate the cost – but this would probably cost them some of their customers. More likely, they would lay off some of their employees and invest in more technology like dump trucks that substitutes for humans.
The higher the wages they must pay, the less labor they would hire.
More Expensive Apples = Less Apples Purchased
How about apples? If you go to your local grocery store and you discover that apple prices have become twice as high overnight, would you still buy some? Maybe but you would probably buy less. You might instead buy more of some other fruit like oranges or pears. If apple prices rise by 10 times, you would move away from apple buying even more.
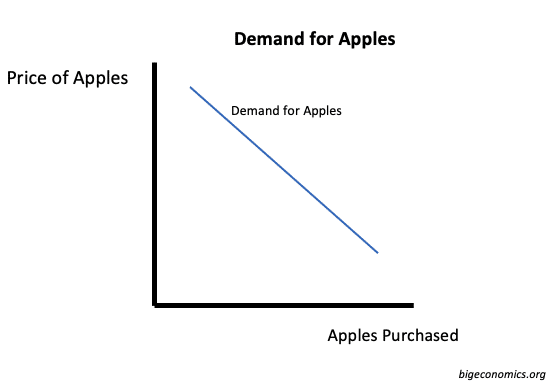
You can summarize this by saying that demand has a negative relationship with price.
If we were to show this graphically, we would draw a downward sloping line for demand.
How the Market Price of Apples is Determined
By combining the supply and demand lines into one graph, we now can show what the market price for apples will be:
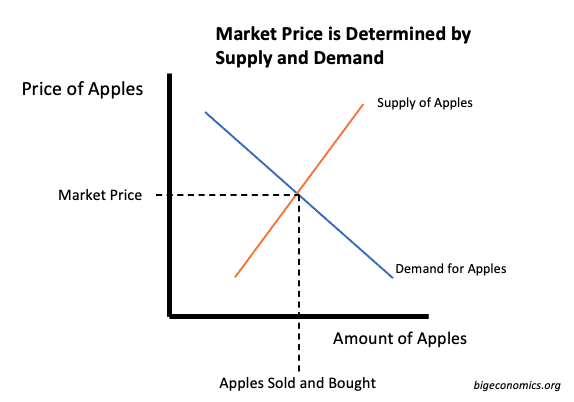
With this last graph, we are starting to see the power of supply and demand. Together, they tell us what the market price of apples will be and how many apples are bought in the market. And this is only the beginning.
How Various Changes Affect the Price
Suppose a deep freeze hits apple producers causing 25% of the apple crop to be destroyed. What will this do to the price of apples or amount sold?
The supply and demand lens gives us a framework to logically think through the effects. Does the destruction of apple crops have any effect on demand for apples? Nope. Consumers don’t change their demand for apples because of the freeze.
Does the freeze have any effect on the suppliers? Of course. The amount of apples farmers can provide to the market has declined. One way to think about it is, that at every price, the farmer now has less apples to sell. How do we add this information to the graph?
It’s a leftward shift of the supply line:
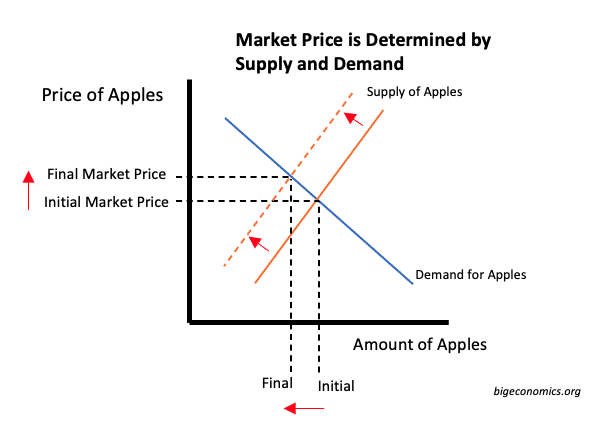
What are the effects of the decreased supply? The market price of apples has increased, and as a result, less apples are bought and sold.
Now I understand that most people aren’t interested in apple pricing, but this example serves as a template for understanding how various goods and services are priced: from forex to interest rates.
Quick Check
Before we go on, here’s a quick quiz to check your understanding:
- Suppose the USDA recommends everyone have at least an apple a day for health reasons. How would you represent this on the supply and demand graph? What would be the final effects on the price of apples and the quantity bought and sold?
- Suppose a new technology is developed that allows apples to be grown and harvested more efficiently, lowering the costs of producing apples. How would you represent this on the supply and demand graph? What would be the final effects on the price of apples and the quantity bought and sold?
Answers
- The announcement would have the effect of increasing demand for apples at every price. This means the demand line shifts to the right. The final effect would be higher prices and more apples consumed.
- Since apples cost less to produce, at every price, farmers would be able to supply more apples. This means the supply line shifts to the right. This would have the effect of lowering the price of apples and increasing the amount sold.
Summary of How Supply and Demand Works
So far we have covered the supply line, and why supply tends to increase as prices increase (upward sloping). We’ve covered the demand line and why demand for anything tends to decrease the more expensive it gets (downward sloping). We’ve shown how when the demand and supply curves are combined, the market price and quantity are determined.
Most importantly, we’ve created a framework to think about the effect a million different things will have on the final market price and quantity bought and sold. This framework is the shifting of the demand and supply curves in response to different “shocks”.
Make sure you understand this before we go on, since this is THE vital tool in utilizing supply and demand to the fullest extent.
Constructing Supply and Demand Curves Step by Step
Foreign Exchange Markets (FOREX)
In the context of foreign exchange we have the price of one currency with respect to the price of another. A typical case is the price of the dollar ($) with respect to the euro (€), which is referred to as the exchange rate. The exchange rate can be thought of as the price, since if you are a European looking to exchange your euros into dollars, the rate of $/€ is the price of dollars.
When the exchange rate is higher, the dollar is cheaper and relatively the euro is more expensive. Vice versa when the exchange rate is low.
What Goes on the Horizontal and Vertical Axes?
So on the vertical axis, we will have the price of euros, represented as the exchange rate of $/€.
What about the horizontal axis, any guesses about what goes there?
It’s simply the amount of euros.
Note: It’s important that if we have $/€ as the price, the amount is to be measured in euros, on the horizontal axis. Why is that? Because the vertical axis has price per unit, and the amount of units always goes on the horizontal axis. So if we had €/$ on the vertical axis, we would need to have $ on the horizontal axis.
The shape of Demand and Supply Lines
What shape will the demand line take?
Again it will be downward sloping. Why is that? It’s because when the exchange rate is high and a European can get a lot of $ per euro, that’s when euros are the most expensive. Thus, at high exchange rates Europeans will relatively demand less euros, and as the exchange rate decreases they will be willing to take on more and more euros.
What about supply, what shape will it take?
It will be upward sloping, as usual. Why? Because when the exchange rate is low, the dollar is very valuable while euros are cheap. In this kind of environment, not many investors will want to sell their euros into the market. At higher exchange rates, when the euro is relatively more valuable, much more people will be willing to sell euros.
For practice, try to combine this information into a graph and you can compare it to mine below.
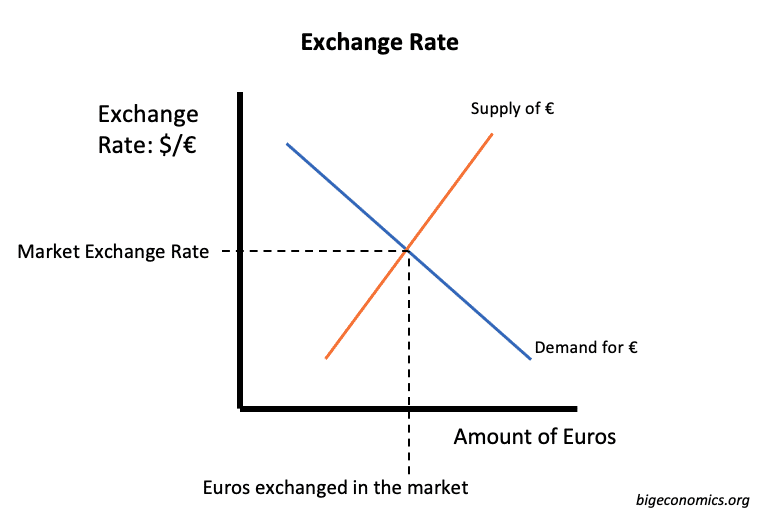
How Will Economic Conditions Affect the Exchange Rate?
With this simple graph, we now have a powerful framework to determine what will happen to the exchange rate as economic conditions change.
Suppose a financial crisis occurs in Europe such as the Greek Crisis of 2009, and suddenly investors find themselves wanting to get rid of Euro bonds due to concerns of defaults. What would happen to the exchange rate?
Investors rushing to get rid of euro bonds and fleeing to safer assets like dollar bonds implies that across the board (for every exchange rate) supply of euros has increased. This is represented graphically as a rightward shift of the supply of euros line.
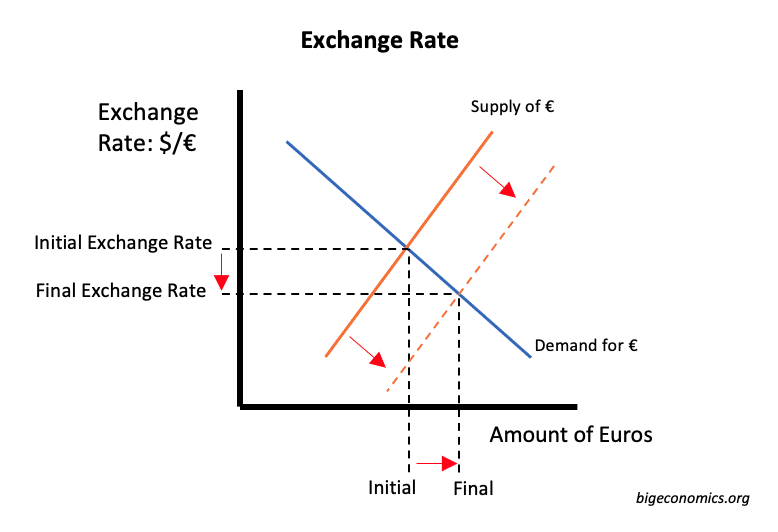
As shown by the graph, the exchange rate falls, meaning the dollar has become stronger, and the amount of euros traded on the market increases.
It should be apparent how this simple supply and demand graph can be used to analyze the effects of various economic conditions on the exchange rate and trade in currency.
Interest Rates
What about the case of interest rates, one of the most important drivers of economic activity in any country. What can supply and demand teach us about how these work?
What Goes on the Horizontal and Vertical Axes?
The interest rate is really a price: the price of holding money. As interest rates increase it becomes more expensive to hold money, and people invest it instead of holding onto it as cash.
Thus we will have the interest rate on the vertical axis and the amount of money on the horizontal axis.
The Shape of Demand and Supply Lines
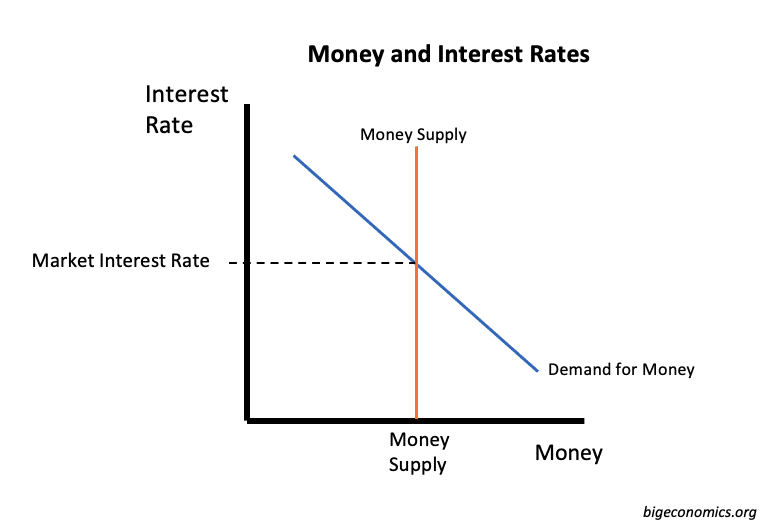
The demand line for money will be downward sloping, because the higher the interest rate, the less money people will want to hold on to.
How about the supply of money? In this case, it wouldn’t be downward sloping, since the money supply is determined by the government, apart from interest rates. This is not to say that the government doesn’t consider interest rates when setting the money supply, just that they arbitrarily choose what the money supply is.
Because of this, the money supply is simply a vertical line.
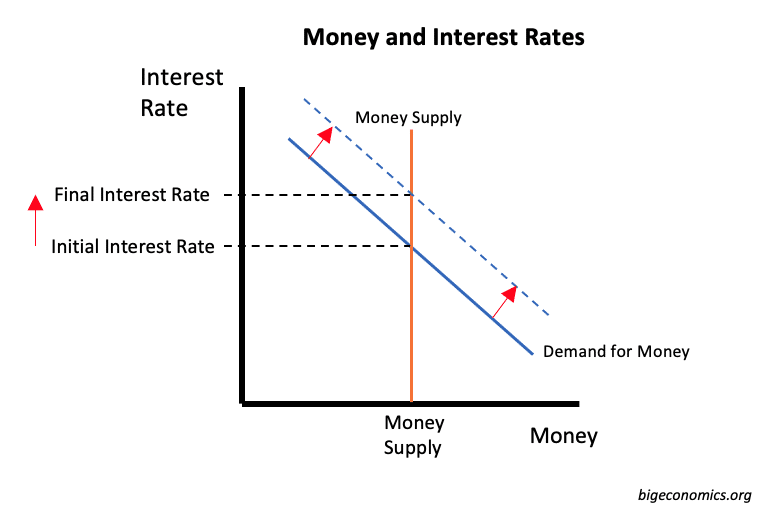
All together, the graph looks like this:
How Will Economic Conditions Affect the Interest Rate?
This gives us a good framework for understanding how interest rate changes under various economic conditions.
Just some of the cases:
The government decides interest rates are too high and wants to lower them. How can it do this? By printing more money and increasing the money supply, shifting the Money Supply (orange line) to the right and lowering interest rates.
Suppose economic activity increases, this means more transactions are happening, meaning demand for money has increased. This can be represented as the Money Demand line shifting to the right, meaning the final market interest rates will be higher than before. This tells us that as as economic activity increases, we can expect interest rates to also increase.
Wrapping It Up
With these several examples, you should have a pretty good idea of why supply and demand is one of the most important tools in economics and how it can help you make sense of all kinds of economic conditions.
Just remember, the price goes on the vertical axis, the quantity of units goes on the horizontal axis. Demand is generally downward sloping, and supply upward sloping. Once you draw these you obtain the initial market equilibrium. Then if you want to simulate the effects of some scenario, just think about whether it’ll affect supply and demand, and how.
With some practice, you’ll be thinking in terms of supply and demand intuitively.
Practice
Work through these practice problems to increase your understanding:
- Suppose there is a large influx of low skilled immigrant labor into the US. According to supply and demand, what effect would this have on the wages of low-skilled workers?
- Suppose that due to the popularity of bitcoin and alternative investments, people start investing less in the stock market than they used to. According to supply and demand, what effect will this have on average stock prices?
Have a comment or another example to share? Leave it below.