
Back to Majors Explorer
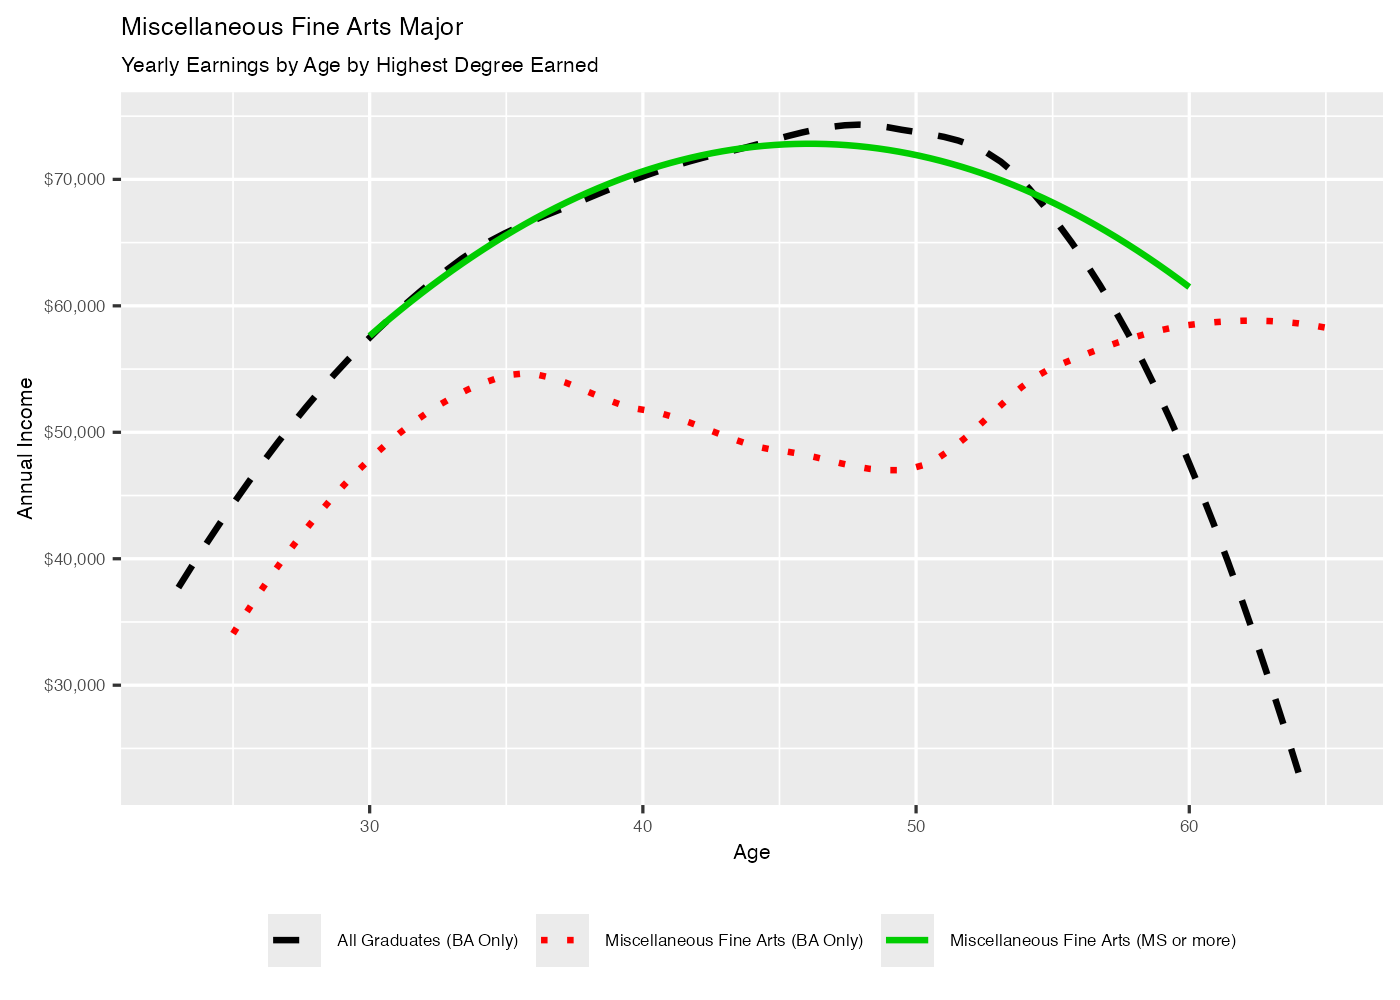
Miscellaneous Fine Arts Majors’ Salary Over the Career
This figure shows median earnings by age for those who majored in Miscellaneous Fine Arts but have a bachelor’s degree only (in red), and those who majored in Miscellaneous Fine Arts but obtained a masters degree or higher in green. For reference, in black are median earnings by age for all college graduates who have a bachelor’s degree only.

This table highlights key outcomes for Miscellaneous Fine Arts majors, compared to averages for all college graduates.
Back to Majors Explorer

Top 10 Early-Career Occupations (Bachelor’s only)
These are the top occupations for Miscellaneous Fine Arts majors aged 25-35 who have a BA only (no graduate degree) and the median income they received in the occupation. The share indicates the percentage of Miscellaneous Fine Arts majors aged 25-35 with a BA only who worked in that occupation.
| Share | Occupation | Income |
|---|---|---|
| 8 | Designers | 56,200 |
| 7 | Software Developers, Applications and Systems Software | 83,000 |
| 5 | Artists and Related Workers | 61,800 |
| 4 | Computer Scientists and Systems Analysts/Network systems Analysts/Web Developers | 55,100 |
| 3 | Managers, nec (including Postmasters) | 59,300 |
| 3 | Retail Salespersons | 23,700 |
| 3 | Computer Programmers | 75,500 |
| 2 | Unemployed | 0 |
| 2 | First-Line Supervisors of Sales Workers | 45,700 |
| 2 | Secretaries and Administrative Assistants | 26,400 |
Top 10 Mid-Career Occupations (Bachelor’s only)
These are the top occupations for Miscellaneous Fine Arts majors aged 45-55 who have a BA only (no graduate degree) and the median income they received in the occupation. The share indicates the percentage of Miscellaneous Fine Arts majors aged 45-55 with a BA only who worked in that occupation.
| Share | Occupation | Income |
|---|---|---|
| 5 | Unemployed | 0 |
| 5 | Elementary and Middle School Teachers | 86,800 |
| 5 | Designers | 43,200 |
| 5 | Managers, nec (including Postmasters) | 147,000 |
| 4 | Retail Salespersons | 41,300 |
| 4 | Management Analysts | 87,700 |
| 4 | Software Developers, Applications and Systems Software | 26,000 |
| 3 | Secretaries and Administrative Assistants | 42,600 |
| 3 | Engineering Technicians, Except Drafters | 140,000 |
| 3 | Artists and Related Workers | 54,300 |
Top 10 Mid-Career Occupations (Master’s Degree or higher)
These are the top occupations for Miscellaneous Fine Arts majors aged 45-55 who have completed graduate work (Masters, PhD, Professional Degree) and the median income they received in the occupation. The share indicates the percentage of Miscellaneous Fine Arts majors aged 45-55 with graduate degrees who worked in that occupation.
| Share | Occupation | Income |
|---|---|---|
| 10 | Unemployed | 0 |
| 7 | Managers, nec (including Postmasters) | 85,500 |
| 7 | Lawyers, and judges, magistrates, and other judicial workers | 96,300 |
| 6 | Librarians | 74,200 |
| 6 | Secretaries and Administrative Assistants | 6,160 |
| 5 | Elementary and Middle School Teachers | 129,000 |
| 5 | Chief executives and legislators/public administration | 133,000 |
| 4 | Tailors, Dressmakers, and Sewers | 39,100 |
| 4 | Archivists, Curators, and Museum Technicians | 36,500 |
| 4 | Postsecondary Teachers | 78,100 |

Top 10 Early-Career Industries
These are the top industries for Miscellaneous Fine Arts majors aged 25-35 and the median income they received in the industry. The share indicates the percentage of Miscellaneous Fine Arts majors aged 25-35 who worked in that industry.
| Share | Industry | Income |
|---|---|---|
| 11 | Computer and data processing services | 73,700 |
| 7 | Colleges and universities | 56,200 |
| 5 | Business services, n.e.c. | 50,800 |
| 4 | Eating and drinking places | 25,800 |
| 4 | Miscellaneous professional and related services | 46,600 |
| 4 | Elementary and secondary schools | 53,500 |
| 3 | Theaters and motion pictures | 61,000 |
| 3 | Electrical machinery, equipment, and supplies, n.e.c. | 71,600 |
| 2 | Department stores | 14,000 |
| 2 | Miscellaneous personal services | 51,600 |
Top 10 Mid-Career Industries
These are the top industries for Miscellaneous Fine Arts majors aged 45-55 and the median income they received in the industry. The share indicates the percentage of Miscellaneous Fine Arts majors aged 45-55 who worked in that industry.
| Share | Industry | Income |
|---|---|---|
| 8 | Elementary and secondary schools | 86,800 |
| 7 | Theaters and motion pictures | 133,000 |
| 6 | N/A (not applicable) | 0 |
| 5 | Colleges and universities | 78,100 |
| 5 | Management and public relations services | 75,800 |
| 4 | Miscellaneous professional and related services | 108,000 |
| 3 | Computer and data processing services | 26,000 |
| 3 | Miscellaneous personal services | 11,300 |
| 3 | Business services, n.e.c. | 12,300 |
| 3 | Miscellaneous entertainment and recreation services | 39,100 |
Back to Majors Explorer